
Football Performance Dashboards & Reporting
Power BI, Tableau and Excel dashboards that bring GPS, RPE, wellness and testing data into one coach-ready view — designed around the questions your staff ask every week.
A dashboard should answer a question in ten seconds
The best football performance dashboard is not the one with the most charts. It is the one a head coach can read before training and know who needs attention. V High Performance designs dashboards backwards: first the questions your staff ask every week, then the data needed to answer them, and only then the visuals.
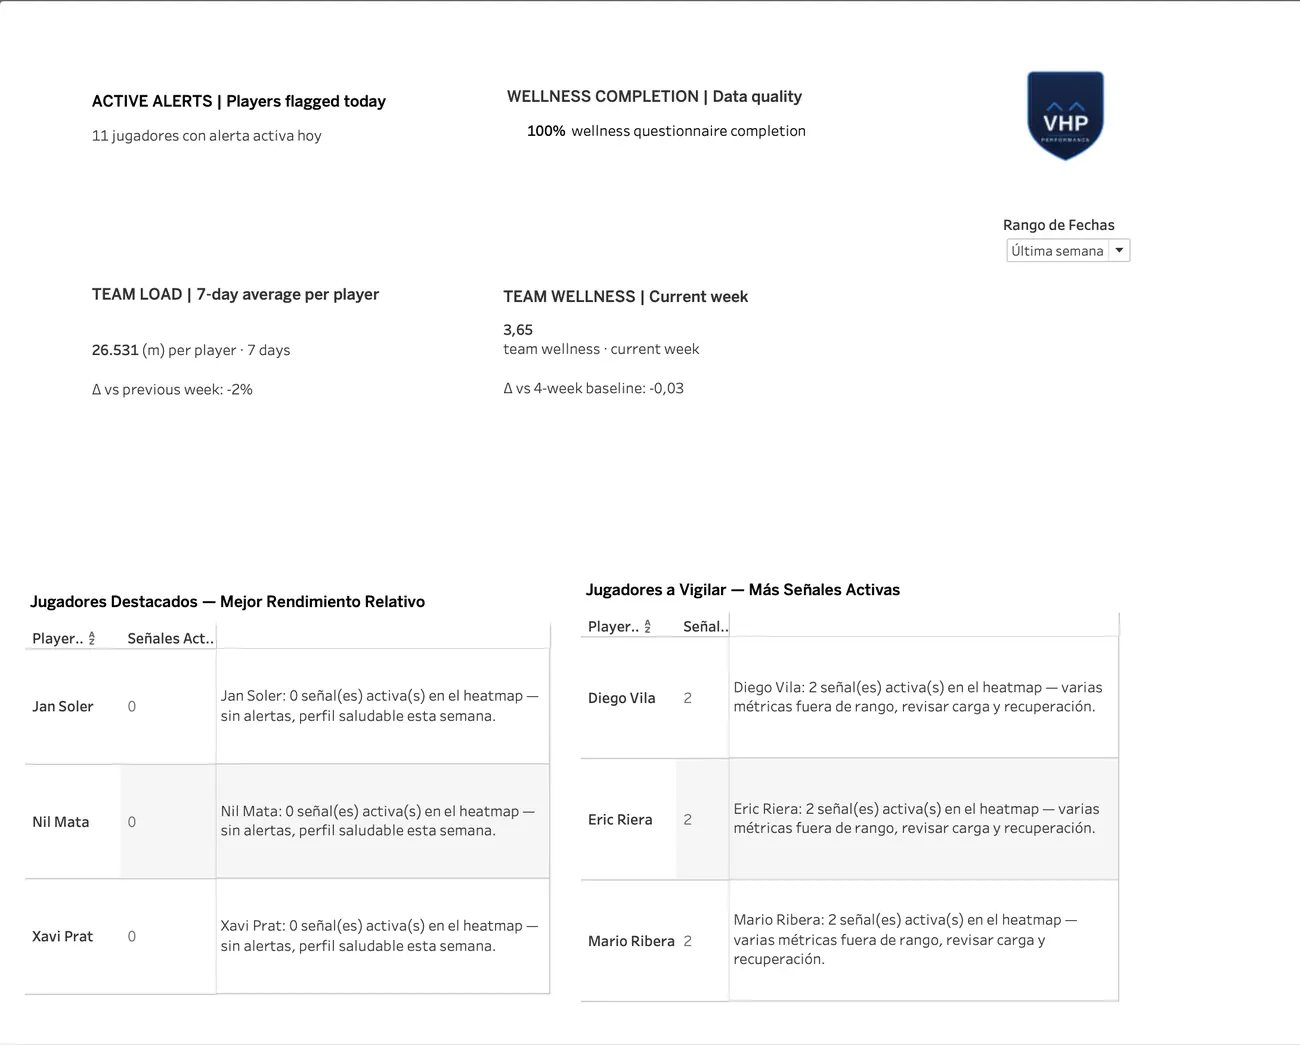
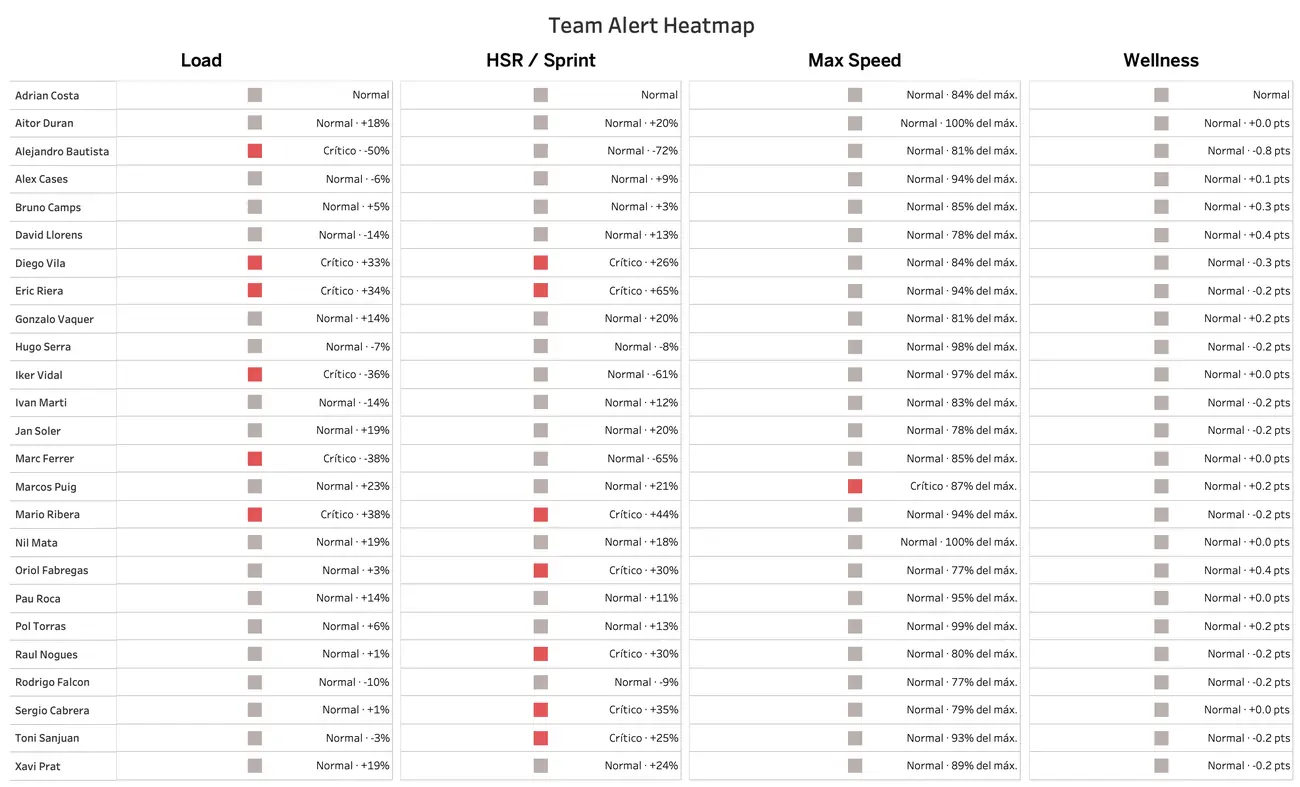
- Who is outside his normal range today?
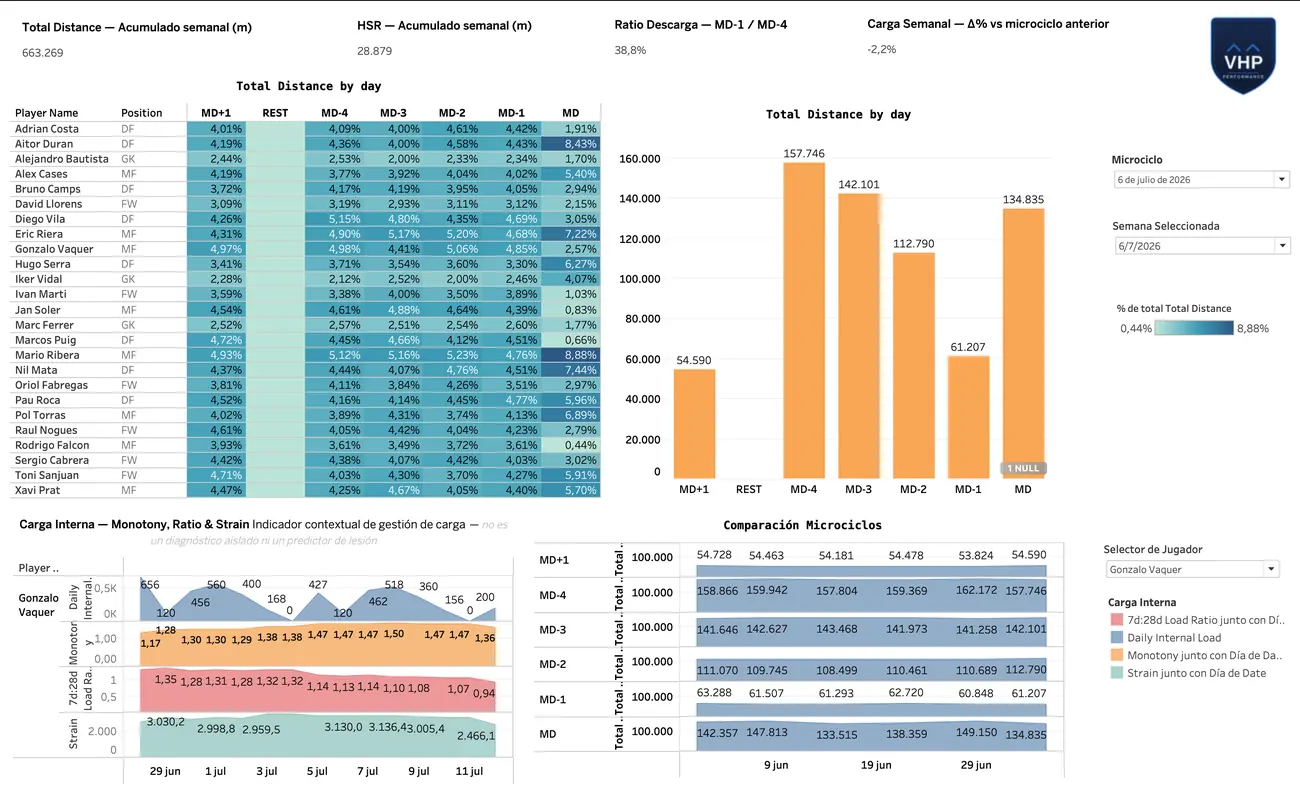
- Was the week delivered as we planned it?
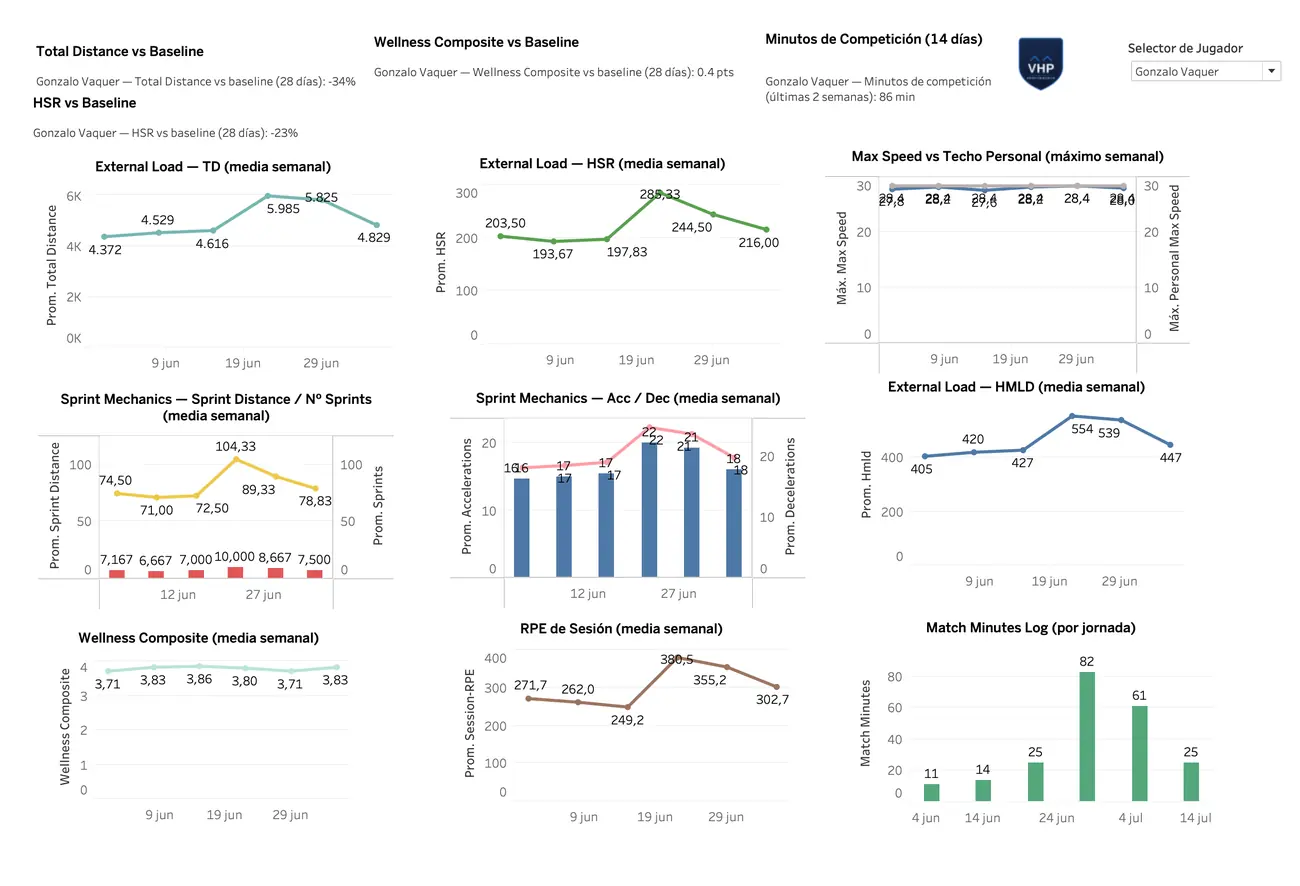
- How does each player compare with his own baseline and his match demands?
- Are the data complete and reliable?
Dashboard views for football staff
The views below come from VHP product demos and use illustrative data — no real players are shown.
From scattered spreadsheets to one reliable report
Define the questions
A short workshop with the staff to agree who uses the dashboard, when, and which decisions it should support.
Build the data model
GPS, RPE, wellness and testing data are cleaned, matched to the same player IDs and dates, and stored in one model.
Design the views
Team, individual and microcycle views, with clear thresholds, consistent colours and no decorative charts.
Hand over and support
Documentation, a short training session for the staff and optional ongoing updates during the season.
An academy stores GPS in one platform, wellness in Google Forms and jump tests in a separate Excel per age group. A single Power BI model brings them together, so the Head of Performance can compare age groups and the U18 coach can check his players on a phone before training.
Dashboards are most useful when they sit inside a monitoring routine. See GPS & training load monitoring and football performance consulting, or download a sample weekly report (PDF, Spanish).
Frequently asked questions
Which tools do you build dashboards in?
Power BI, Tableau, Excel and Python or R. The choice depends on what your club already licenses and who will use the dashboard — there is no point building in a tool the staff cannot open.
Can the dashboard update automatically?
In most cases, yes. Data pipelines can be set up so that new GPS exports, RPE and wellness entries are cleaned and loaded with minimal manual work. The level of automation depends on your systems and licences.
Do we own the dashboard?
Yes. Dashboards built for a club are delivered to the club, with documentation so your staff can keep using them.
Can you build dashboards from our existing Excel files?
Yes. Many projects start by consolidating scattered spreadsheets into one clean data model before any visual is built.
Is a dashboard enough on its own?
Rarely. A dashboard is a tool, not the product. It works best as part of a clear monitoring routine and a weekly conversation with the staff, which is why it is often combined with GPS monitoring and consulting.
Other ways V High Performance can help
Want to talk about your club's performance process?
Tell me how your staff currently plans, monitors and reports — I'll reply with a practical first step.
Get in touch